


 |
|


FISABIO Bioinformatics Service - Taxonomy Annotation Pipeline (V4)
| Home | Introduction | Files | Samples Summary | Taxonomy Tables | Krona Viewer | Alpha Diversity | Methods | References |
|---|
Covernote: This demo shows the functioning and outputs of taxonomy annotation pipeline (Upstream Analysis) from FISABIO Sequencing and Bioinformatics service. Data used belong to already published work and are used only for demonstrative purpose.
Project basename: DemoTaxonomyUpstream
Project advisor email: seqserbioinfo_fisabio@gva.es
Project advisor phone: +34 961 925929
Introduction
The aim of this document is to drive you through the reading af the analysis. The basic idea of the manuscript is to provide a user-friendly approach to taxonomic analysis by the mean of bacterial 16S rDNA gene, 18S eukaryotic rDNA gene, fungal ITS, etc.
By clicking on hyperlinks it is possible to navigate among the table of contents, figures, tables and bibliographic references. All statistics have been obtained using The RStatistics software Rstatistics, making use of several Open Source libraries such as gdata, vegan, etc.
All tables are stored in the folder tables_and_biomes. Each file name self-explains the data.
Columns are separated by comma thus files are provided in csv (comma separated values) format. All tables could be easily imported in almost all spreadsheet softwares.
Some big file could be stored in gzip format, a common Unix compression algorithm. In Microsoft Windows systems, standard decompressing tools should be able to access these kinds of files.
For disambiguation of metagenomics/metataxonomy terminology we suggest the read of Marchesi, et al. (2015).
We hope you find this report helpful and for any suggestions or bug notification, please contact us by e-mail to seqserbioinfo_fisabio@gva.es.
Provided results
Uncompressing the result file provided by the service, you will find following elements:
-
TaxonomyReport-DemoV5_rdp_16srrna.html: This file.
-
KronaViewer_DemoV5_rdp_16srrna.html: KRONA representation of taxonomy distributions.
-
working_data folder: Folder containing the fasta files for each sample where reads names were renamed following the syntax sample_id. This format is compatible with other taxonomic suites such as qiime.
-
Otables_and_biomes folder: Folder with all tables showed in this report in csv format.
- RDP data: RDP output files as follow:
- .rdp tabbed data;
- .hier hierarchy files;
- cnadjusted_sample.hier hierarchy files applying genome copy number adjustment.
Data filtering
- Main data reported in contingency tables or KRONA diversity representation have been obtained considering the whole dataset including singletons or and under-represented taxa.
- Alpha diversity indexes have been obtained reducing the dataset removing those taxa which were represented by less than 3 sequences.
Samples summary
Following table shows the counts of reads by sample with mean and standard deviation length values.
| Sample | NReads | MeanLength | SDLength |
|---|---|---|---|
| AE-1 | 1108 | 490.00 | 95.10 |
| AE-2 | 2782 | 481.18 | 112.18 |
| AE-3 | 1343 | 480.93 | 112.75 |
| AE-4 | 2952 | 474.37 | 117.16 |
| AQ-1 | 1349 | 470.96 | 127.20 |
| AQ-2 | 697 | 476.42 | 120.84 |
| AQ-3 | 1172 | 479.72 | 107.16 |
| AQ-4 | 1993 | 449.00 | 143.65 |
| AW-1 | 3135 | 492.78 | 96.58 |
| AW-2 | 2148 | 495.07 | 83.96 |
| AW-3 | 1948 | 490.04 | 92.34 |
| AW-4 | 3241 | 474.81 | 118.54 |
| BR-1 | 2084 | 490.57 | 99.12 |
| BR-2 | 3321 | 482.58 | 112.46 |
| BR-3 | 57 | 342.93 | 196.08 |
| BR-4 | 1837 | 410.74 | 173.01 |
| BT-1 | 830 | 489.67 | 100.21 |
| BT-2 | 3727 | 493.28 | 94.24 |
| BT-3 | 60 | 353.77 | 196.29 |
| BT-4 | 1636 | 454.02 | 140.68 |
Taxonomy reads distribution tables
This section provides taxonomy tables calculated at various taxonomic ranks: as Phylum, Class, Order, Family, Genus and Species.
NB: Species taxonomic rank is provided only if greengen database is chosen.
Only reads longer than 50nt have been considered.
Contingency and proportion tables are stored in tables and biomes main folder.
| Taxon | AE.1 | AE.2 | AE.3 | AE.4 | AQ.1 | AQ.2 | AQ.3 | AQ.4 | AW.1 | AW.2 | AW.3 | AW.4 | BR.1 | ... |
|---|---|---|---|---|---|---|---|---|---|---|---|---|---|---|
| Archaea;ud-Archaea | 3 | 18 | 1 | 5 | 4 | 0 | 1 | 12 | 6 | 7 | 1 | 12 | 3 | ... |
| Bacteria;Actinobacteria | 6 | 138 | 26 | 34 | 8 | 34 | 3 | 22 | 12 | 91 | 19 | 26 | 1 | ... |
| Bacteria;Bacteroidetes | 55 | 229 | 16 | 54 | 110 | 37 | 10 | 17 | 262 | 81 | 21 | 45 | 841 | ... |
| Bacteria;Cyanobacteria/Chloroplast | 2 | 0 | 0 | 0 | 0 | 0 | 0 | 0 | 0 | 0 | 0 | 0 | 0 | ... |
| Bacteria;Deinococcus-Thermus | 0 | 0 | 0 | 0 | 0 | 0 | 0 | 0 | 1 | 0 | 0 | 0 | 0 | ... |
| Bacteria;Firmicutes | 997 | 2058 | 1202 | 2710 | 1139 | 469 | 1104 | 1750 | 2751 | 1769 | 1834 | 2978 | 1122 | ... |
| Bacteria;Fusobacteria | 0 | 18 | 0 | 0 | 0 | 2 | 0 | 0 | 1 | 6 | 0 | 0 | 0 | ... |
| Bacteria;Lentisphaerae | 0 | 0 | 0 | 0 | 0 | 0 | 0 | 0 | 0 | 0 | 0 | 0 | 0 | ... |
| Bacteria;Proteobacteria | 19 | 161 | 4 | 5 | 10 | 109 | 1 | 4 | 11 | 115 | 1 | 10 | 63 | ... |
| Bacteria;Synergistetes | 0 | 0 | 0 | 0 | 0 | 0 | 0 | 0 | 0 | 0 | 0 | 0 | 0 | ... |
| Bacteria;ud-Bacteria | 26 | 153 | 94 | 144 | 78 | 45 | 53 | 188 | 91 | 73 | 72 | 170 | 54 | ... |
| Bacteria;Verrucomicrobia | 0 | 7 | 0 | 0 | 0td> | 1 | 0 | 0 | 0 | 6 | 0 | 0 | 0 | ... |
NB: Family and Genus contingency tables are similarly provided but omitted in this demo.
| Taxon | AE.1 | AE.2 | AE.3 | AE.4 | AQ.1 | AQ.2 | AQ.3 | AQ.4 | AW.1 | AW.2 | AW.3 | ... |
|---|---|---|---|---|---|---|---|---|---|---|---|---|
| Archaea;ud-Archaea | 0.271 | 0.647 | 0.074 | 0.169 | 0.297 | 0.000 | 0.085 | 0.602 | 0.191 | 0.326 | 0.051 | ... |
| Bacteria;Actinobacteria | 0.542 | 4.960 | 1.936 | 1.152 | 0.593 | 4.878 | 0.256 | 1.104 | 0.383 | 4.236 | 0.975 | ... |
| Bacteria;Bacteroidetes | 4.964 | 8.231 | 1.191 | 1.829 | 8.154 | 5.308 | 0.853 | 0.853 | 8.357 | 3.771 | 1.078 | ... |
| Bacteria;Cyanobacteria/Chloroplast | 0.181 | 0.000 | 0.000 | 0.000 | 0.000 | 0.000 | 0.000 | 0.000 | 0.000 | 0.000 | 0.000 | ... |
| Bacteria;Deinococcus-Thermus | 0.000 | 0.000 | 0.000 | 0.000 | 0.000 | 0.000 | 0.000 | 0.000 | 0.032 | 0.000 | 0.000 | ... |
| Bacteria;Firmicutes | 89.982 | 73.976 | 89.501 | 91.802 | 84.433 | 67.288 | 94.198 | 87.807 | 87.751 | 82.356 | 94.148 | ... |
| Bacteria;Fusobacteria | 0.000 | 0.647 | 0.000 | 0.000 | 0.000 | 0.287 | 0.000 | 0.000 | 0.032 | 0.279 | 0.000 | ... |
| Bacteria;Lentisphaerae | 0.000 | 0.000 | 0.000 | 0.000 | 0.000 | 0.000 | 0.000 | 0.000 | 0.000 | 0.000 | 0.000 | ... |
| Bacteria;Proteobacteria | 1.715 | 5.787 | 0.298 | 0.169 | 0.741 | 15.638 | 0.085 | 0.201 | 0.351 | 5.354 | 0.051 | ... |
| Bacteria;Synergistetes | 0.000 | 0.000 | 0.000 | 0.000 | 0.000 | 0.000 | 0.000 | 0.000 | 0.000 | 0.000 | 0.000 | ... |
| Bacteria;ud-Bacteria | 2.347 | 5.500 | 6.999 | 4.878 | 5.782 | 6.456 | 4.522 | 9.433 | 2.903 | 3.399 | 3.696 | ... |
| Bacteria;Verrucomicrobia | 0.000 | 0.252 | 0.000 | 0.000 | 0.000 | 0.143 | 0.000 | 0.000 | 0.000 | 0.279 | 0.000 | ... |
NB: Family and Genus proportion tables are similarly provided but omitted in this demo.
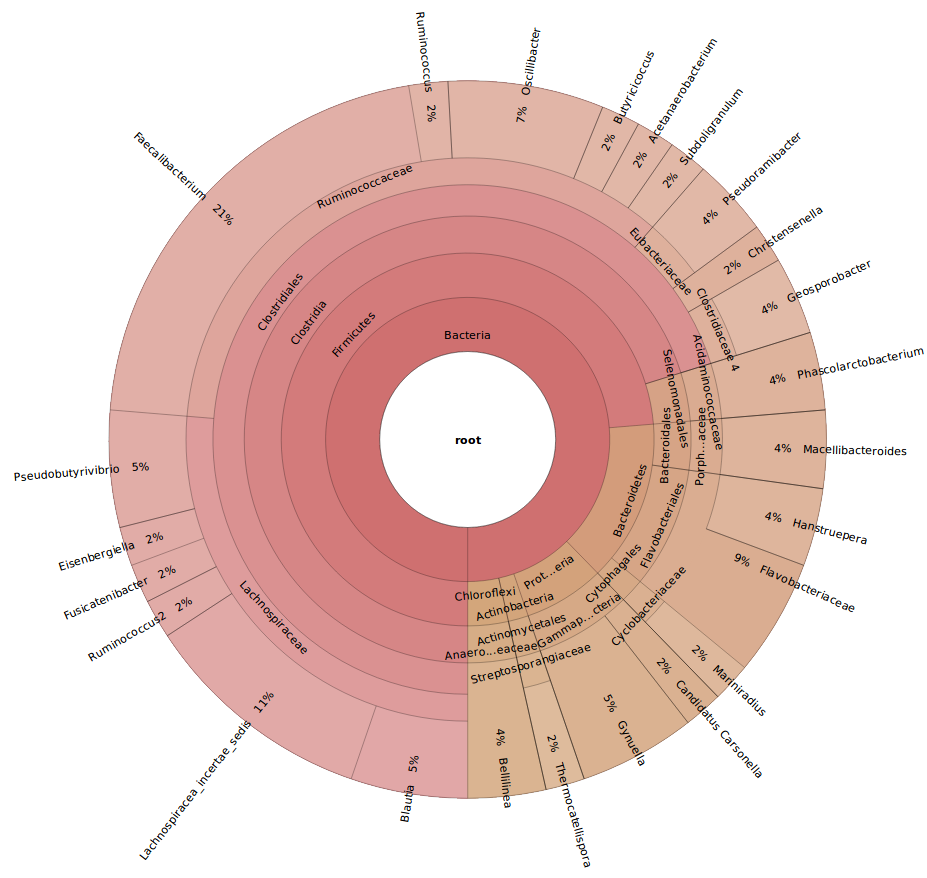
KronaViewer representation
The following link open a web page where all diversity is summarised using KRONA tool. Taxonomic annotation tables are parsed to this tool and an interactive viewer will show taxa distributions by samples. The tool allows browsing and zooming within each taxonomic rank. Images could be exported by clicking on Snapshot button for further uses. If you use these images, please cite Ondov, et al. (2011).
Alpha diversity
This section describes diversity indexes characterizing every sample at Phylum, Family and Genus taxonomy rank levels. All tables can be found in the Diversity folder. Columns report for each sample:
- Diversity estimators
- Shannon Index
- Simpson Index
- invSimpson
- fisherAlpha
- Richness estimators
- Number of observations
- Chao1
- Chao1standard error
- ACE
- ACE standard error
| Shannon | Simpson | invSimpson | fisherAlpha | OBS | CHAO1 | CHAO1.SE | ACE | ACE.SE | |
|---|---|---|---|---|---|---|---|---|---|
| AE-1 | 0.46 | 0.19 | 1.23 | 1.00 | 7 | 7 | 0.00 | 7.00 | 1.31 |
| AE-2 | 0.98 | 0.44 | 1.78 | 1.01 | 8 | 8 | 0.00 | 8.00 | 0.94 |
| AE-3 | 0.44 | 0.19 | 1.24 | 0.81 | 6 | 6 | 0.46 | 7.12 | 0.98 |
| AE-4 | 0.37 | 0.15 | 1.18 | 0.72 | 6 | 6 | 0.00 | 6.00 | 1.15 |
| AQ-1 | 0.60 | 0.28 | 1.38 | 0.81 | 6 | 6 | 0.00 | 6.00 | 1.22 |
| AQ-2 | 1.06 | 0.51 | 2.06 | 1.08 | 7 | 7 | 0.23 | 8.00 | 0.97 |
| AQ-3 | 0.26 | 0.11 | 1.12 | 0.83 | 6 | 7 | 2.22 | 9.18 | 1.72 |
| AQ-4 | 0.47 | 0.22 | 1.28 | 0.76 | 6 | 6 | 0.00 | 6.00 | 0.91 |
| AW-1 | 0.48 | 0.22 | 1.29 | 0.99 | 8 | 9 | 2.25 | 12.05 | 1.34 |
| AW-2 | 0.74 | 0.31 | 1.46 | 1.05 | 8 | 8 | 0.00 | 8.00 | 1.37 |
| AW-3 | 0.28 | 0.11 | 1.13 | 0.77 | 6 | 7 | 2.22 | NA | NA |
| AW-4 | 0.37 | 0.15 | 1.18 | 0.71 | 6 | 6 | 0.00 | 6.00 | 0.91 |
| BR-1 | 0.91 | 0.55 | 2.20 | 0.76 | 6 | 6 | 0.46 | 7.11 | 0.99 |
| BR-2 | 0.50 | 0.22 | 1.29 | 0.98 | 8 | 9 | 2.25 | 12.07 | 1.45 |
| BR-3 | 0.65 | 0.46 | 1.84 | 0.40 | 2 | 2 | 0.00 | NA | NA |
| BR-4 | 0.81 | 0.41 | 1.70 | 0.77 | 6 | 6 | 0.00 | 6.00 | 0.91 |
| BT-1 | 0.84 | 0.53 | 2.13 | 0.71 | 5 | 5 | 0.45 | 6.10 | 1.12 |
| BT-2 | 0.48 | 0.22 | 1.29 | 0.83 | 7 | 7 | 0.23 | 8.11 | 1.40 |
| BT-3 | 0.71 | 0.41 | 1.70 | 0.66 | 3 | 3 | 0.00 | 3.00 | 0.82 |
| BT-4 | 0.66 | 0.31 | 1.46 | 0.79 | 6 | 6 | 0.00 | 6.00 | 1.15 |
NB: Family and Genus Alpha diversity tables are similarly provided but omitted in this demo.
Other methods
Library preparation
16S rDNA gene amplicons were amplified following the 16S rDNA gene Metagenomic Sequencing Library Preparation Illumina protocol. The gene-specific sequences used in this protocol target the 16S rDNA gene V3-V4 region. Illumina adapter overhang nucleotide sequences are added to the gene-specific sequences. The primers are selected from the Klindworth et al. publication (Klindworth, et al., 2013). The full length primer sequences, using standard IUPAC nucleotide nomenclature, to follow the protocol targeting this region are:
16S rDNA gene Amplicon PCR Forward Primer = 5'
TCGTCGGCAGCGTCAGATGTGTATAAGAGACAGCCTACGGGNGGCWGCAG
16S rDNA gene Amplicon PCR Reverse Primer = 5'
GTCTCGTGGGCTCGGAGATGTGTATAAGAGACAGGACTACHVGGGTATCTAATCC
We used microbial genomic DNA (5 ng/ul in 10 mM Tris pH 8.5) to initiate the protocol. After 16S rDNA gene amplification, the mutiplexing step was performed using Nextera XT Index Kit (FC-131-1096). We run 1 ul of the PCR product on a Bioanalyzer DNA 1000 chip to verify the size, the expected size on a Bioanalyzer trace is 550bp. After size verification the libraries were sequenced using a 2x300pb paired-end run (MiSeq Reagent kit v3 (MS-102-3001)) on a MiSeq Sequencer according to manufacturer's instructions (Illumina).
Quality assessment
Quality assessment was performed by the use of prinseq-lite program (Schmieder, et al., 2011) applying following parameters:
- min_length: 50
- trim_qual_right: 30
- trim_qual_type: mean
- trim_qual_window: 10
R1 and R2 from Illumina sequencing where joined using fastq-join from ea-tools suite (Aronesty, 2011)
Bioinformatics analysis
Data have been obtained using an ad-hoc pipeline written in R Rstatistics language (R Core Team, 2012), making use of several Open Source libraries such as gdata, vegan, etc. Data have been grouped and stratified according to the metadata file provided by the user.
Taxonomic annotation
Taxonomic affiliations have been assigned using the RDP_classifier from the Ribosomal Database Project (Cole, et al., 2009). All data have been tabulated. Reads with RDP score value below 0.8 have been assigned to the upper taxonomic rank leaving last rank as unidentified (e.g. Firmicutes, Bacillales, Bacillaceae, Unidentified Bacillaceae).
R packages
The pipeline core runs by R Rstatistics language (R Core Team, 2012). All calculation and statistics have been carried out within this environment. Here a list of the used packages and their references.
- lattice: graphics for R (Sarkar, 2008).
- knitr, knitcitations, markdown: report and reference environment (Xie, 2014; Boettiger, 2014; Allaire, et al., 2014).
- Bioconductor packages for genomics data: Biostrings.
References
Allaire J, et al. markdown: Markdown rendering for R. R package version 0.7.4. 2014. URL: http://CRAN.R-project.org/package=markdown.
Anderson MJ. "A new method for non-parametric multivariate analysis of variance". In: Austral Ecology 26.1 (2001), pp. 32–46. ISSN: 14429985. DOI: 10.1046/j.1442-9993.2001.01070.x. URL: http://doi.wiley.com/10.1046/j.1442-9993.2001.01070.x.
Aronesty E. ea-utils: Command-line tools for processing biological sequencing data. ea-utils: FASTQ processing utilities. 2011. URL: http://code.google.com/p/ea-utils.
Boettiger C. knitcitations: Citations for knitr markdown files. R package version 1.0.5. 2014. URL: http://CRAN.R-project.org/package=knitcitations.
Cole JR, et al. The Ribosomal Database Project: improved alignments and new tools for rRNA analysis. Nucleic Acids Res. 2009 Jan;37(Database issue):D141-5. doi: 10.1093/nar/gkn879. Epub 2008 Nov 12. [PubMed Central:PMC2686447] [DOI:10.1093/nar/gkn879] [PubMed:19004872] , pp. D141–145.
Klindworth A, Pruesse E, Schweer T, Peplies J, Quast C, Horn M, Glöckner FO. Evaluation of general 16S ribosomal RNA gene PCR primers for classical and next-generation sequencing-based diversity studies. Nucleic Acids Res. 2013 Jan 7;41(1):e1. doi: 10.1093/nar/gks808. Epub 2012 Aug 28 [PubMed Central:PMC3592464] [DOI:10.1093/nar/gks808] [PubMed:22933715] , p. e1.
Legendre P, et al. (1999) "DISTANCE-BASED REDUNDANCY ANALYSIS : TESTING MULTISPECIES RESPONSES IN MULTIFACTORIAL ECOLOGICAL EXPERIMENTS". In: Ecological Monographs 69.1, pp. 1–24. ISSN: 00129615. DOI: 10.2307/2657192. URL: http://www.jstor.org/stable/2657192?origin=crossref.
Ondov BD, Bergman NH, Phillippy AM. Interactive metagenomic visualization in a Web browser. BMC Bioinformatics. 2011 Sep 30;12:385. doi: 10.1186/1471-2105-12-385. [PubMed Central:PMC4520061] [DOI:10.1186/s40168-015-0094-5] [PubMed:26229597] 12:385.
Magoc T, Salzberg SL. FLASH: fast length adjustment of short reads to improve genome assemblies. Bioinformatics. 2011 Nov 1;27(21):2957-63. Epub 2011 Sep 7. PubMed: 21903629; PubMed Central: PMC3198573.
Marchesi JR, Ravel J. The vocabulary of microbiome research: a proposal.Microbiome. 2015 Jul 30;3:31. [PubMed Central:PMC4520061] [DOI:10.1186/s40168-015-0094-5] [PubMed:26229597] , p. 31.
R Core Team. R: A Language and Environment for Statistical Computing. ISBN 3-900051-07-0. R Foundation for Statistical Computing. Vienna, Austria, 2012. URL: http://www.R-project.org/.
Sarkar D. Lattice: Multivariate Data Visualization with R. ISBN 978-0-387-75968-5. New York: Springer, 2008. URL: http://lmdvr.r-forge.r-project.org.
Schmieder R, Edwards R. Quality control and preprocessing of metagenomic datasets. Bioinformatics. 2011 Mar 15;27(6):863-4. . [PubMed Central:PMC3051327] [DOI:10.1093/bioinformatics/btr026] [PubMed:21278185] , pp. 863–864.
Xie Y. Dynamic Documents with R and knitr. ISBN 978-1482203530. Chapman and Hall/CRC, 2014. URL: http://yihui.name/knitr/.